Mitch Richling: 3D Mandelbrot Sets
| Author: | Mitch Richling |
| Updated: | 2022-12-10 |
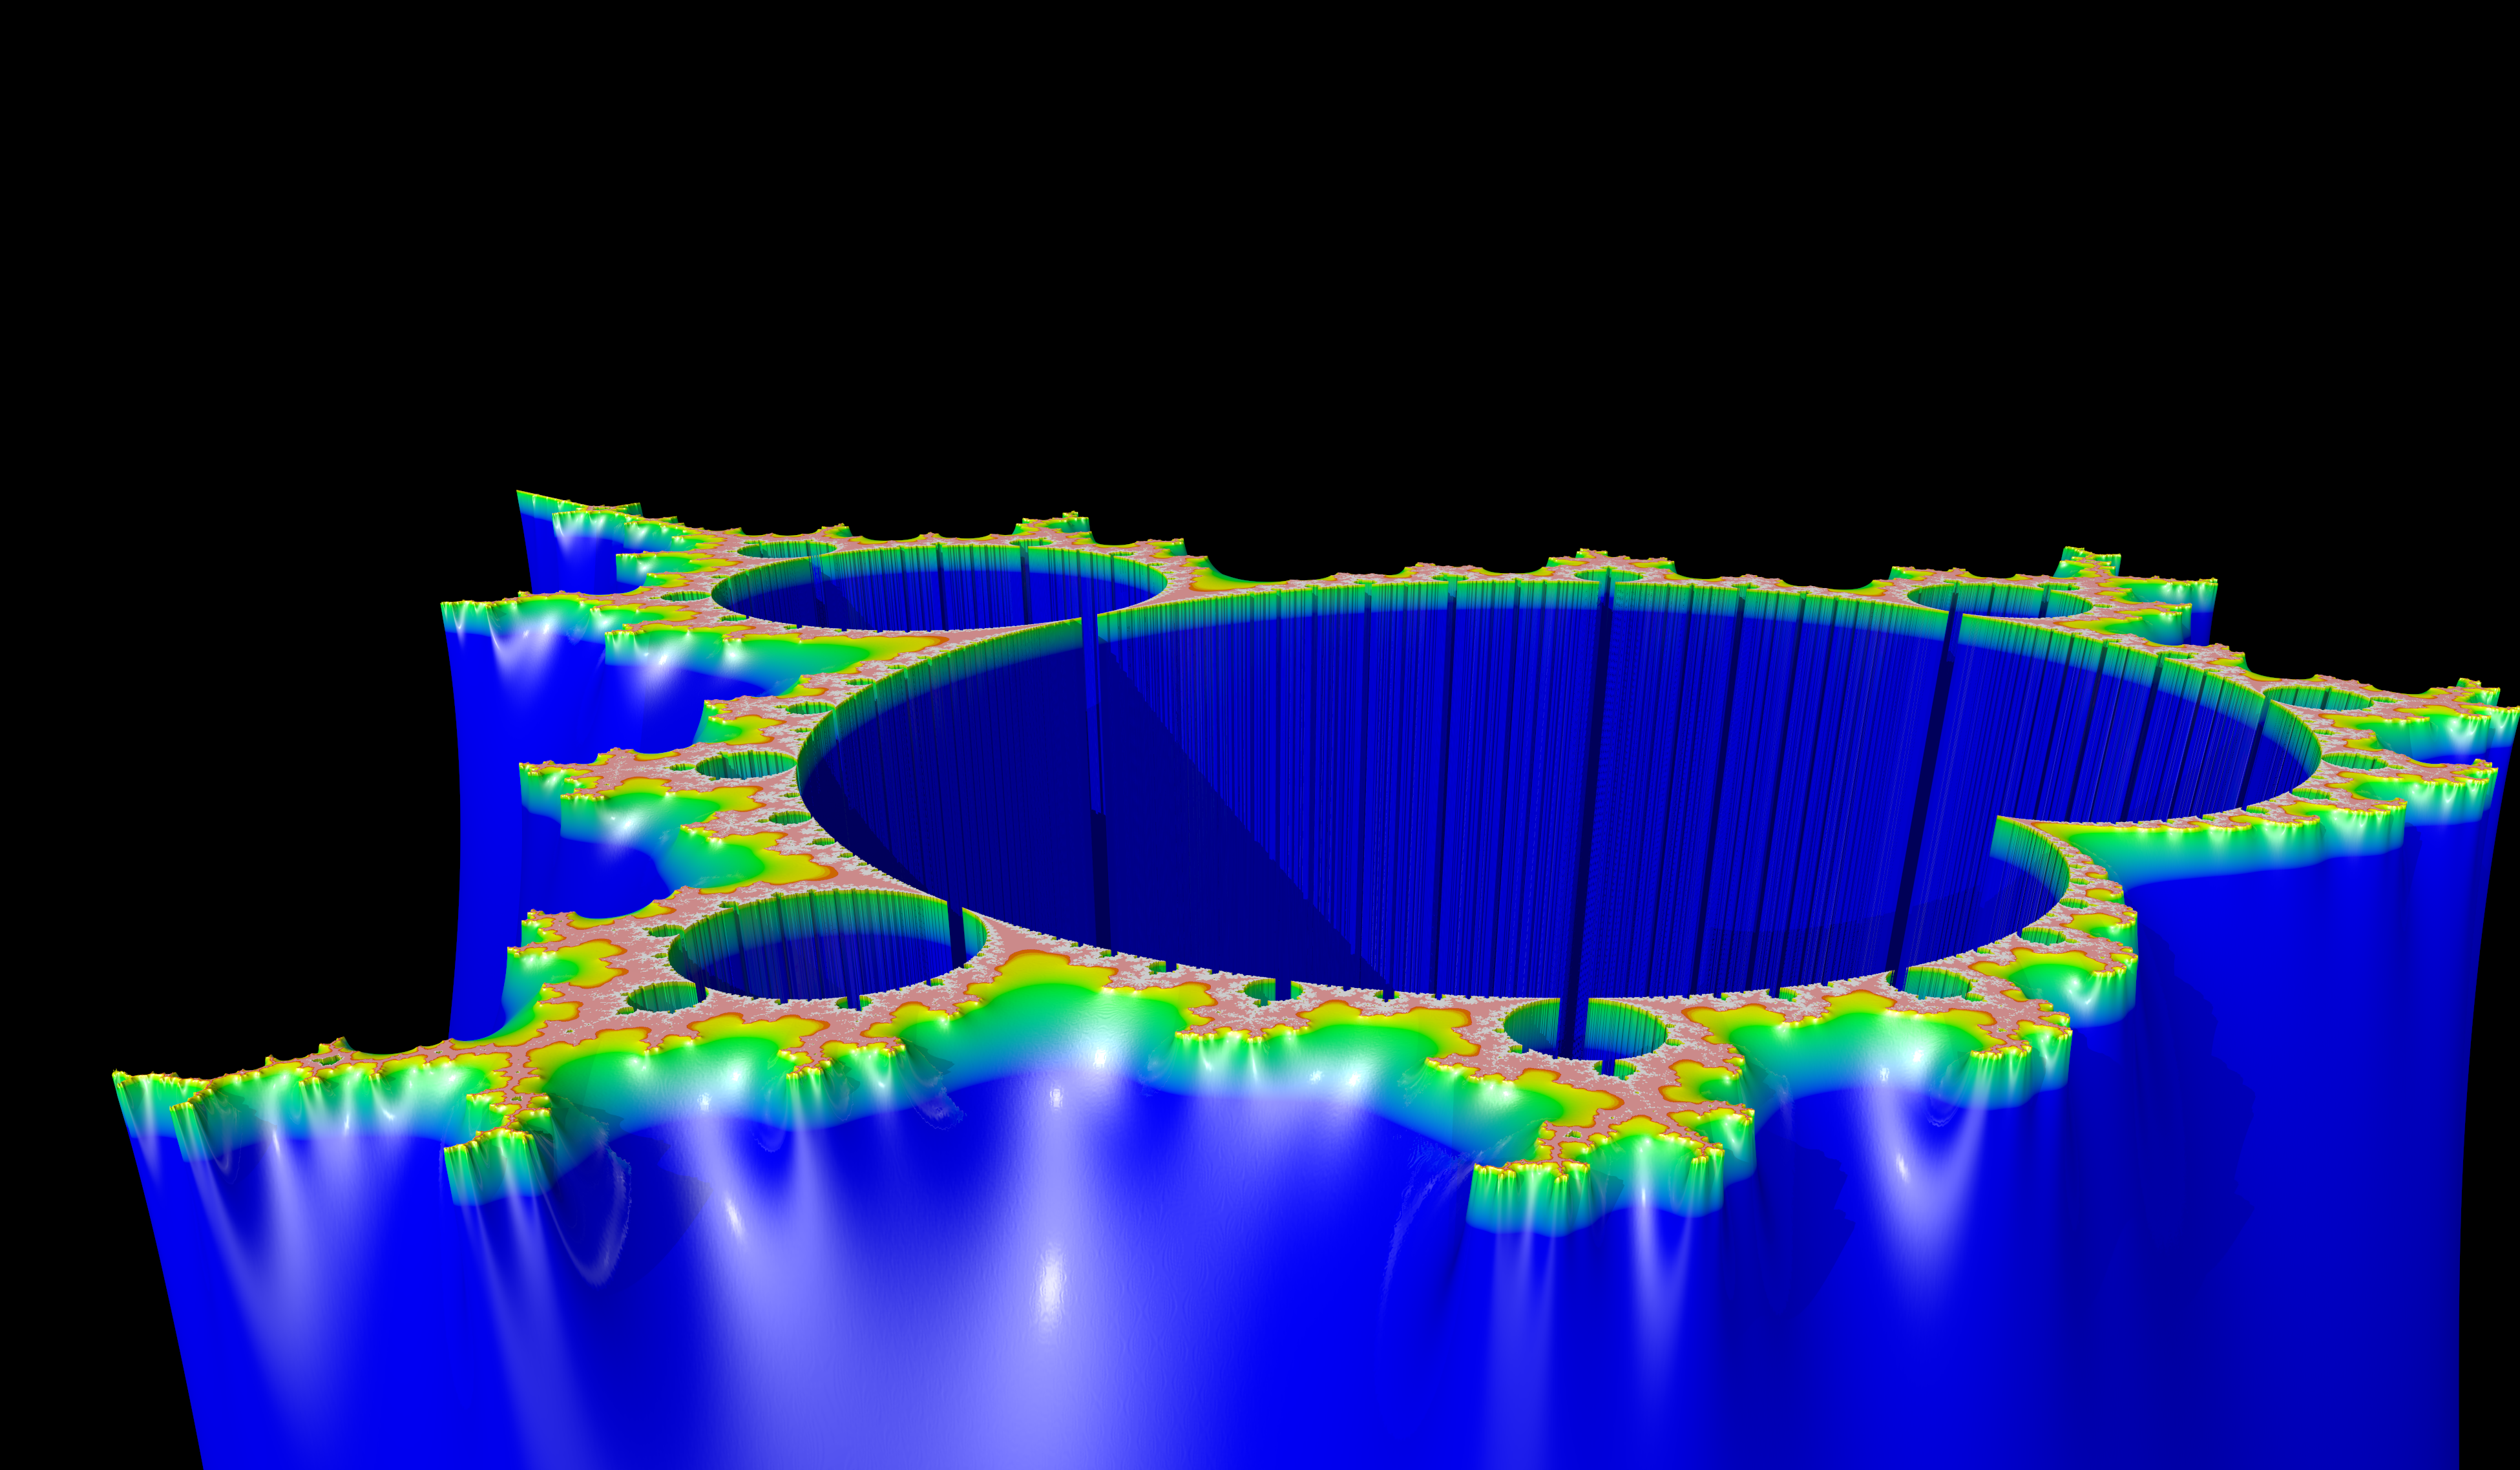
Table of Contents
1. Introduction
When I was an undergraduate student images of the Mandelbrot set were everywhere in the media, but I only really came to appreciate the Mandelbrot set after spending some quality time learning about the underlying mathematics. I fondly recall many hours spent churning out computer programs to draw the thing at the time, and many more hours waiting for them to run! This page isn't about 2D renderings of the Mandelbrot set I first came to know as a youngster, but a class of 3D renderings of the Set (commonly called Mandelbrot Mountains).
If you are unfamiliar with the Mandelbrot set, then you might want to review the section Some Mathematical Details first.
2. Algorithms
By far the most common choice for rendering the Mandelbrot set is to visualize the \(L\) function. The general idea is to map an array of pixels making up the raster image to a rectangular region of the complex plane, and color each pixel of the image based upon a color scale for the computed value of the \(L\) function. Coding up this idea leads to the following C++ program:
#include "ramCanvas.hpp"

typedef mjr::ramCanvas3c8b::colorType ct;

int main(void) {
  std::chrono::time_point<std::chrono::system_clock> startTime = std::chrono::system_clock::now();
  const int    IMGSIZ = 7680/4;
  const int    MAXITR = 1024;
  const double MAXZSQ = 4.0;
  mjr::ramCanvas3c8b theRamCanvas(IMGSIZ, IMGSIZ, -2.2, 0.8, -1.5, 1.5);

#pragma omp parallel for schedule(static,1)
  for(int y=0;y<theRamCanvas.getNumPixY();y++) {
    for(int x=0;x<theRamCanvas.getNumPixX();x++) {
      std::complex<double> c = theRamCanvas.int2real(x, y);
      std::complex<double> z(0.0, 0.0);
      int count = 0;
      while((std::norm(z)<MAXZSQ) && (count<=MAXITR)) {
        z=std::pow(z, 2) + c;
        count++;
      }
      if(count < MAXITR)
        theRamCanvas.drawPoint(x, y, ct::csCColdeFireRamp::c(static_cast<ct::csIntType>(count*30)));
    }
  }
  theRamCanvas.writeTIFFfile("mandelbrot_simple.tiff");
  std::chrono::duration<double> runTime = std::chrono::system_clock::now() - startTime;
  std::cout << "Total Runtime " << runTime.count() << " sec" << std::endl;
}
The above program will generate this picture:
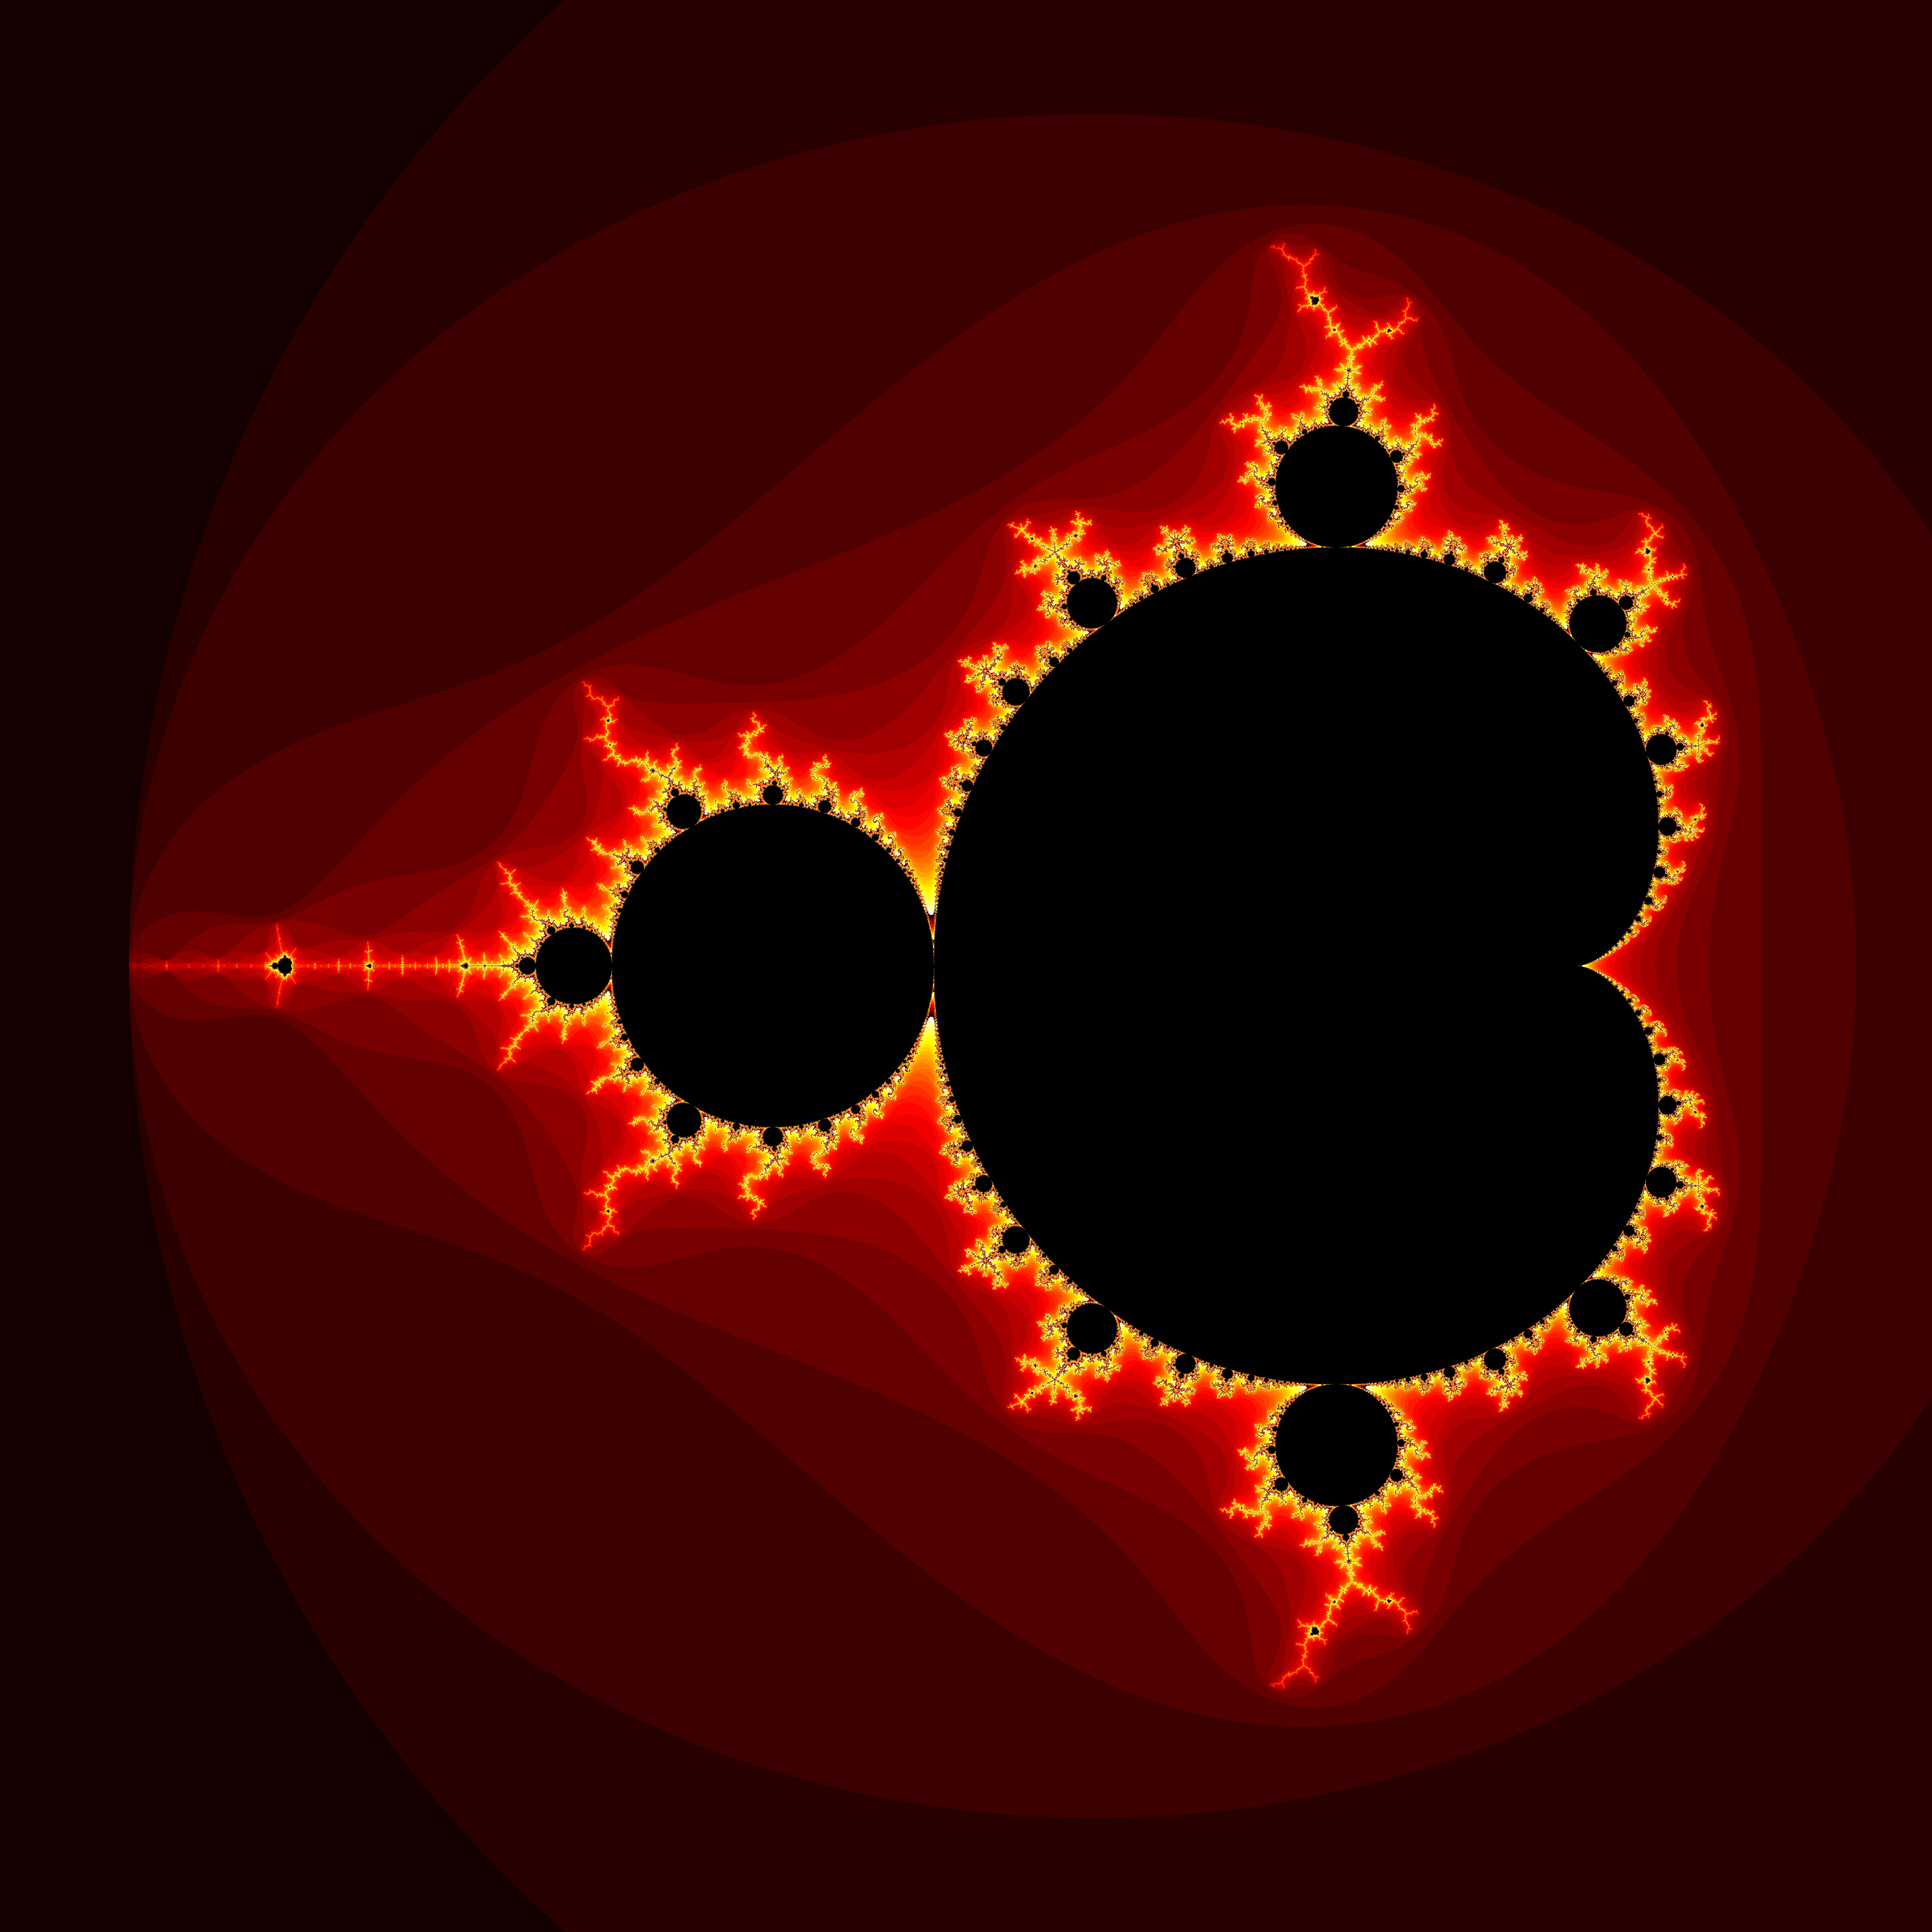
While this is a pretty picture, the step changes in color visually illustrate that the function \(L\) is NOT a continuous. If we rendered a mountain from this data it would resemble the rice terrace farmlands of the Philippine Cordilleras! We want a smooth mountain, and so \(L\) will never do. What we need is continuous function, and we have two obvious choices: \(G\) and \(E\)! Here is a bit of code that will produce what we are looking for:
#include "ramCanvas.hpp"

/** Reasons iteration may stop */
enum class whyStopMPO { OUTSET,   //!< Not in set (|z|>BALL)
                        MAXCOUNT, //!< Maximum iteration reached
                        INSET     //!< In set (known region)
                      };

/* This is out here so that it will get allocated on the heap. I'm too lazy to use malloc just this moment. */
const int CSIZE = 4096;
double theValues[CSIZE][CSIZE];

double ranges[3][4] = { { -2.0,        1.0,       -1.5,        1.5       },
                        { -0.12,      -0.03,      -0.92,      -0.81      },
                        {  0.0353469,  0.5353469,  0.1153845,  0.6153845 } };

int main(void) {
  std::chrono::time_point<std::chrono::system_clock> startTime = std::chrono::system_clock::now();
  const int          MAXITR    = 6000;
  const double       BALL      = 10000000.0;
  double             maxPot    = 0;
  double             minPot    = BALL;
  mjr::ramCanvas3c8b::colorType     aColor;
  mjr::ramCanvas3c8b theRamCanvas(CSIZE, CSIZE);
  whyStopMPO         why;

  for(int i=0; i<3; i++) {
    //for(int i : { 0 } ) {
    theRamCanvas.newRealCoords(ranges[i][0], ranges[i][1], ranges[i][2], ranges[i][3]);
    theRamCanvas.clrCanvasToBlack();
    /* Compute the potential function on our grid.  For off-set points we store the potential in an array,
       for in-set points we store a -1.  */
    std::complex<double> z;
    for(int y=0;y<theRamCanvas.getNumPixY();y++) {
      if((y%(CSIZE/10))==0)
        std::cout << "    CASE: " << i << " LINE: " << y << "/" << CSIZE << std::endl;
      for(int x=0;x<theRamCanvas.getNumPixX();x++) {
        int count;
        double cr = theRamCanvas.int2realX(x);
        double ci = theRamCanvas.int2realY(y);
        std::complex<double> c(cr, ci);
        double p = std::abs(c-0.25);
        if((cr >= p-2.0*p*p+0.25) && std::abs(c+1.0) >= 0.25) {
          z=c;
          for(count=0; ; count++) {
            if(count>=MAXITR) {
              why = whyStopMPO::MAXCOUNT;
              break;
            }
            if(std::abs(z)>BALL) {
              why = whyStopMPO::OUTSET;
              break;
            }
            z = z * z + c;
          }
        } else {
          why = whyStopMPO::INSET;
        }
        if(why == whyStopMPO::OUTSET) {
          double pot = 0;
          if(count<1000) {
            double zn = std::norm(z);
            if(zn > 1) {
              pot = 0.5*log(zn)/pow(2.0, count);
            }
          }
          theValues[x][y]=pot;
          if(maxPot < pot) { maxPot = pot; }
          if(minPot > pot) { minPot = pot; }
        } else {
          theValues[x][y] = -1;
        }
      }
    }

    std::cout << "MIN: " << minPot << " MAX:" << maxPot << std::endl;

    /* Draw a POV-Ray height field from the potential data.  This one will have the Mandelbrot set itself
       set to zero height (black).  This allows us to render canyon-like images.  Rendering this data in 3D
       will tend to emphasize the edge of the set (the walls of the canyon), so a high maximum iteration
       count will yield better results. */
    std::cout << "TGA_1" << std::endl;
    for(int x=0;x<theRamCanvas.getNumPixX();x++) {
      for(int y=0;y<theRamCanvas.getNumPixY();y++) {
        double pot=theValues[x][y];
        if(pot >=  0) {
          pot = pot - minPot;
          pot=(0xffff-1)-pot*(0xffff-2)/(maxPot-minPot);
          aColor.setRGBcmpGreyTGA16bit(static_cast<uint16_t>(pot));
        } else {
          aColor.setToBlack();
        }
        theRamCanvas.drawPoint(x, y, aColor);
      }
    }
    theRamCanvas.writeTGAfile("mandelbrot_potential_a_" + std::to_string(i) + ".tga");

    /* Draw a POV-Ray height field from the potential data.  This one will have the Mandelbrot set itself
       set the maximum height.  This allows us to render plateau-like images. */
    std::cout << "TGA_2" << std::endl;
    for(int x=0;x<theRamCanvas.getNumPixX();x++)
      for(int y=0;y<theRamCanvas.getNumPixY();y++)
        if(theValues[x][y] <  0)
          theRamCanvas.drawPoint(x, y, aColor.setRGBcmpGreyTGA16bit(0xffff-1));
    theRamCanvas.writeTGAfile("mandelbrot_potential_b_" + std::to_string(i) + ".tga");

    /* We dump out 16-bit unsigned integers less than 2^15 so that they may be interpreted as signed
       integers by tools like VisIT which might read the data via the BOV file. */
    std::cout << "RAW_2" << std::endl;
    mjr::ramCanvas1c16b theRamCanvasG(CSIZE, CSIZE);
    for(int x=0;x<theRamCanvasG.getNumPixX();x++) {
      for(int y=0;y<theRamCanvasG.getNumPixY();y++) {
        double pot=theValues[x][y];
        if(pot >= 0) {
          pot = pot - minPot;
          pot=(0x8000-1)-pot*(0x8000-2)/(maxPot-minPot);
          theRamCanvasG.drawPoint(x, y, static_cast<mjr::ramCanvas1c16b::colorChanType>(pot));
        } else {
          theRamCanvasG.drawPoint(x, y, 0x8000-1);
        }
      }
    }
    theRamCanvasG.writeRAWfile("mandelbrot_potential_" + std::to_string(i) + ".mrw");
    theRamCanvasG.autoHistStrech();
    theRamCanvasG.writeTIFFfile("mandelbrot_potential_" + std::to_string(i) + ".tiff");
  }
  std::chrono::duration<double> runTime = std::chrono::system_clock::now() - startTime;
  std::cout << "Total Runtime " << runTime.count() << " sec" << std::endl;
}

Now that we have smooth data, the next step is to somehow get that data into a 3D rendering package. The key to doing this is the cmpGreyTGA16bit in the
code above. It computes a color appropriate for a special kind of 16-bit TGA file that POV-Ray can use for a height field.
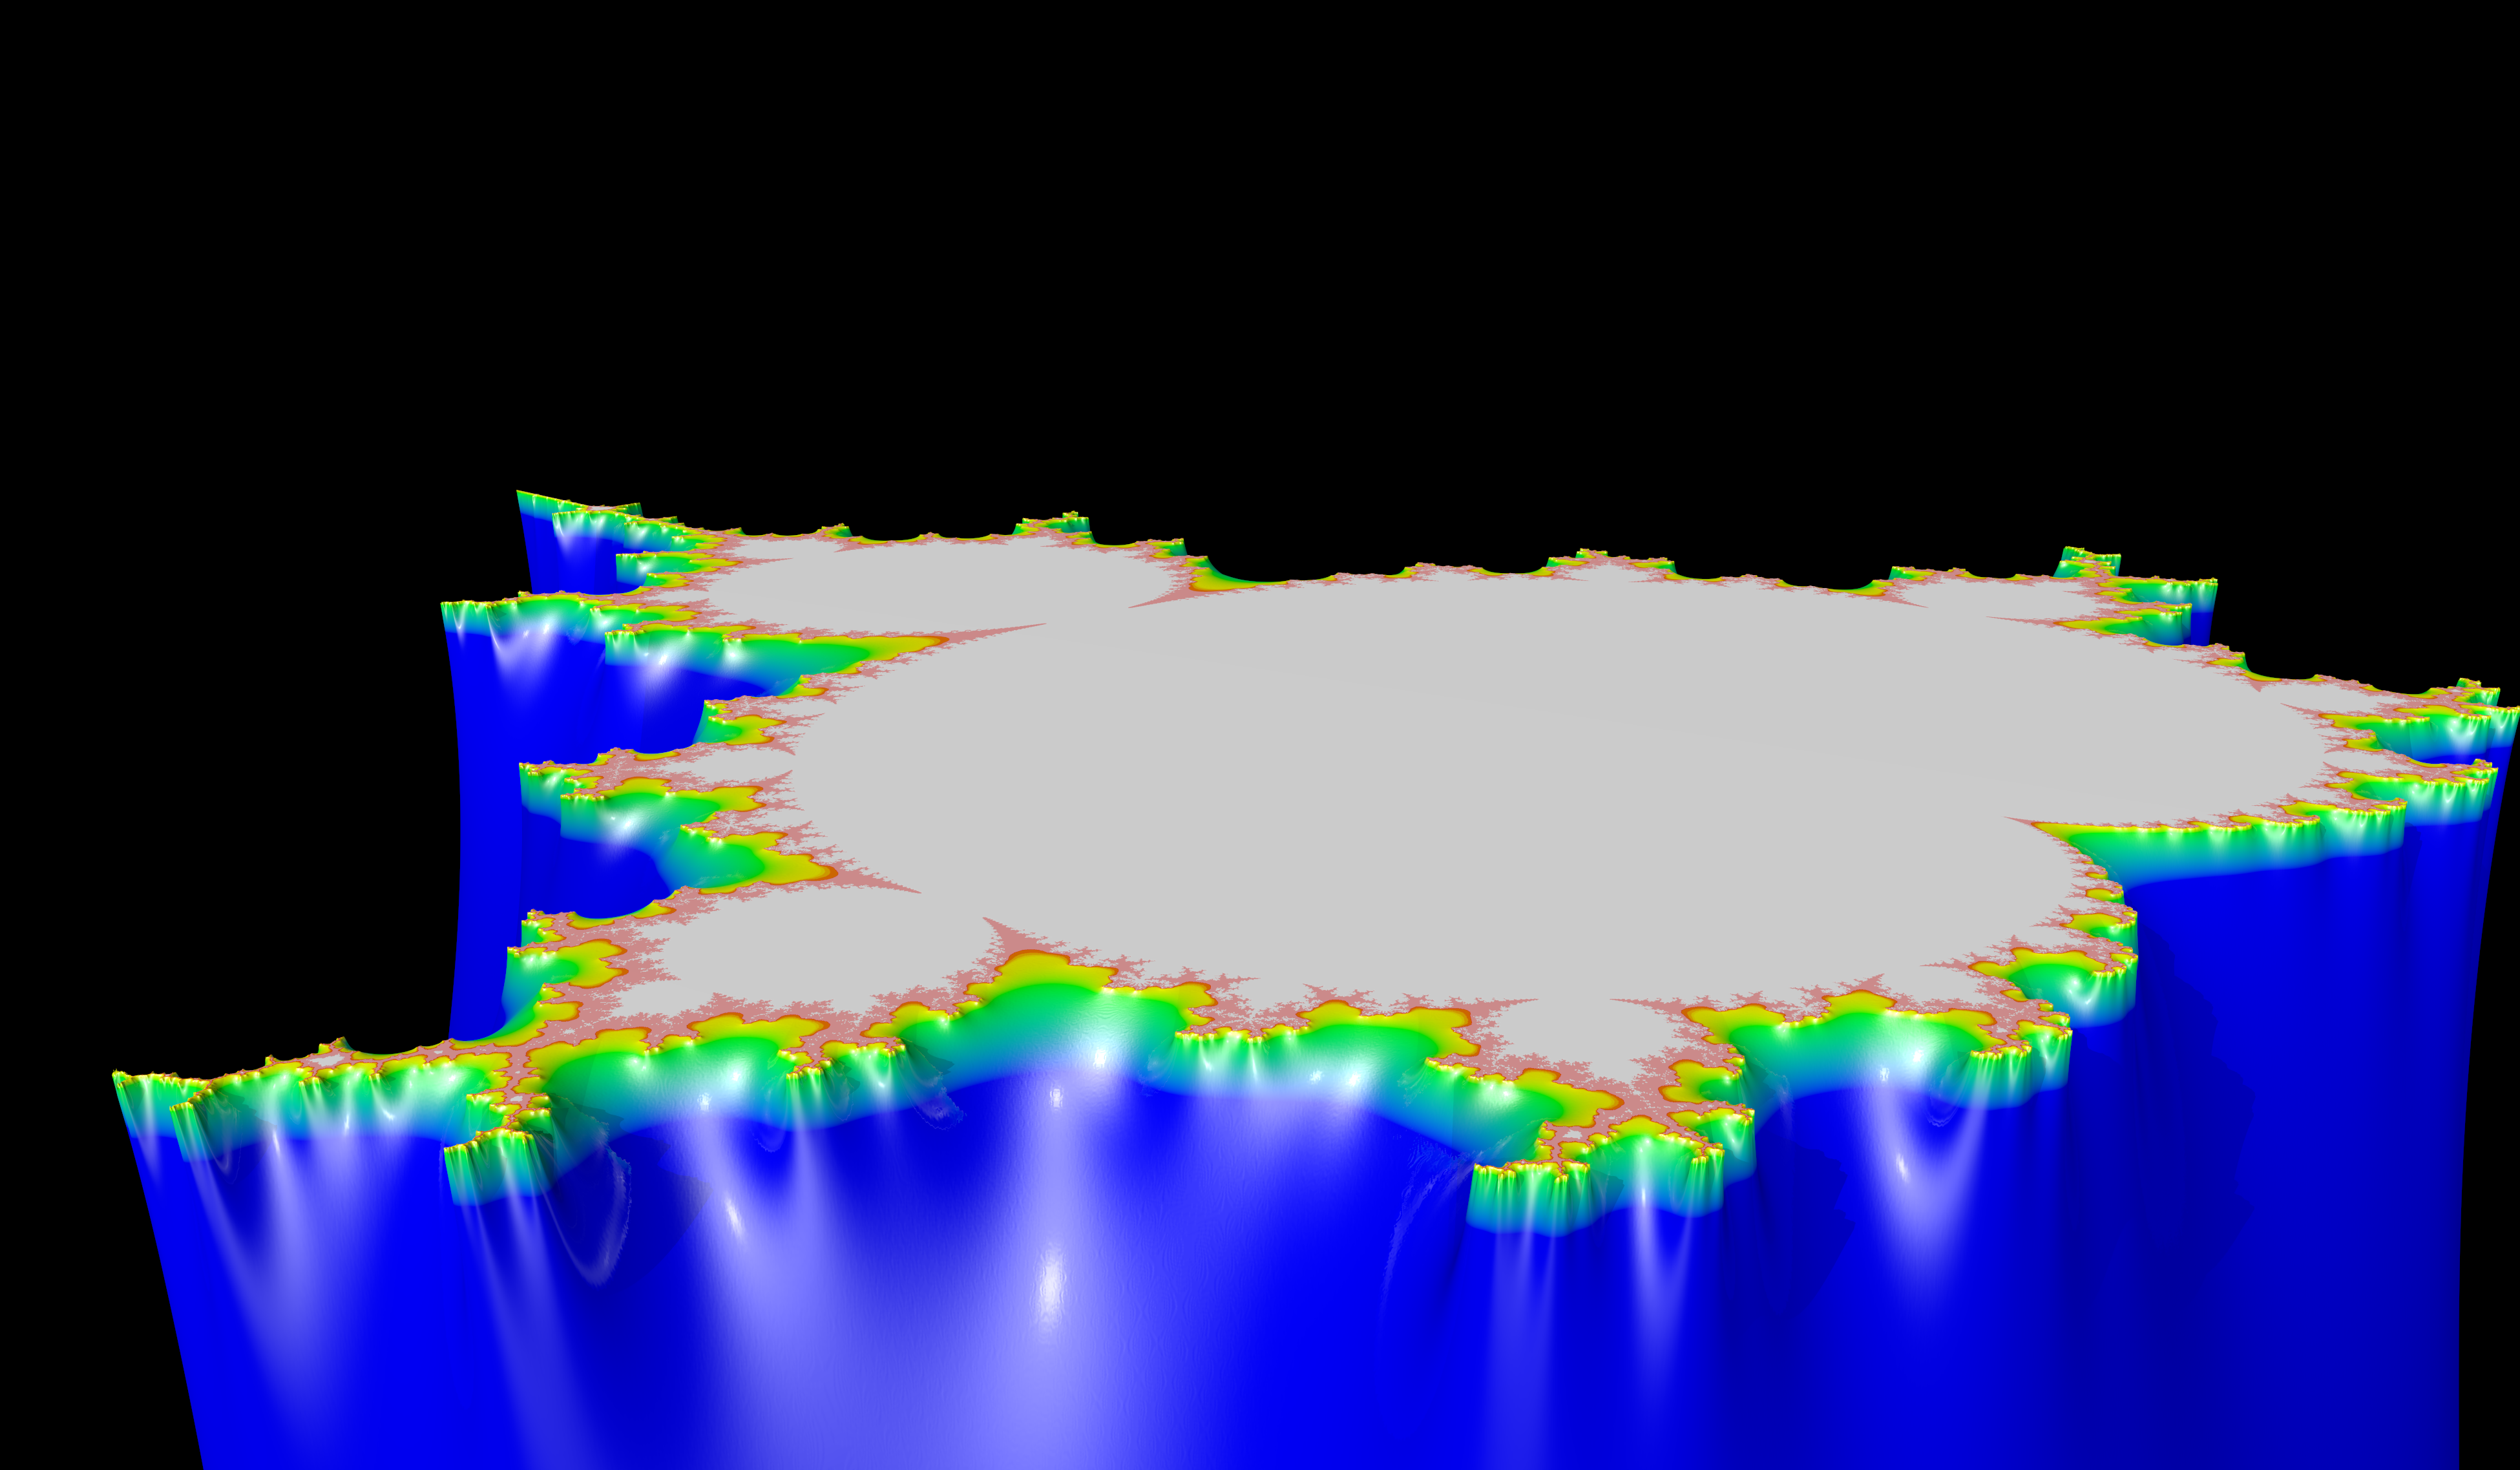
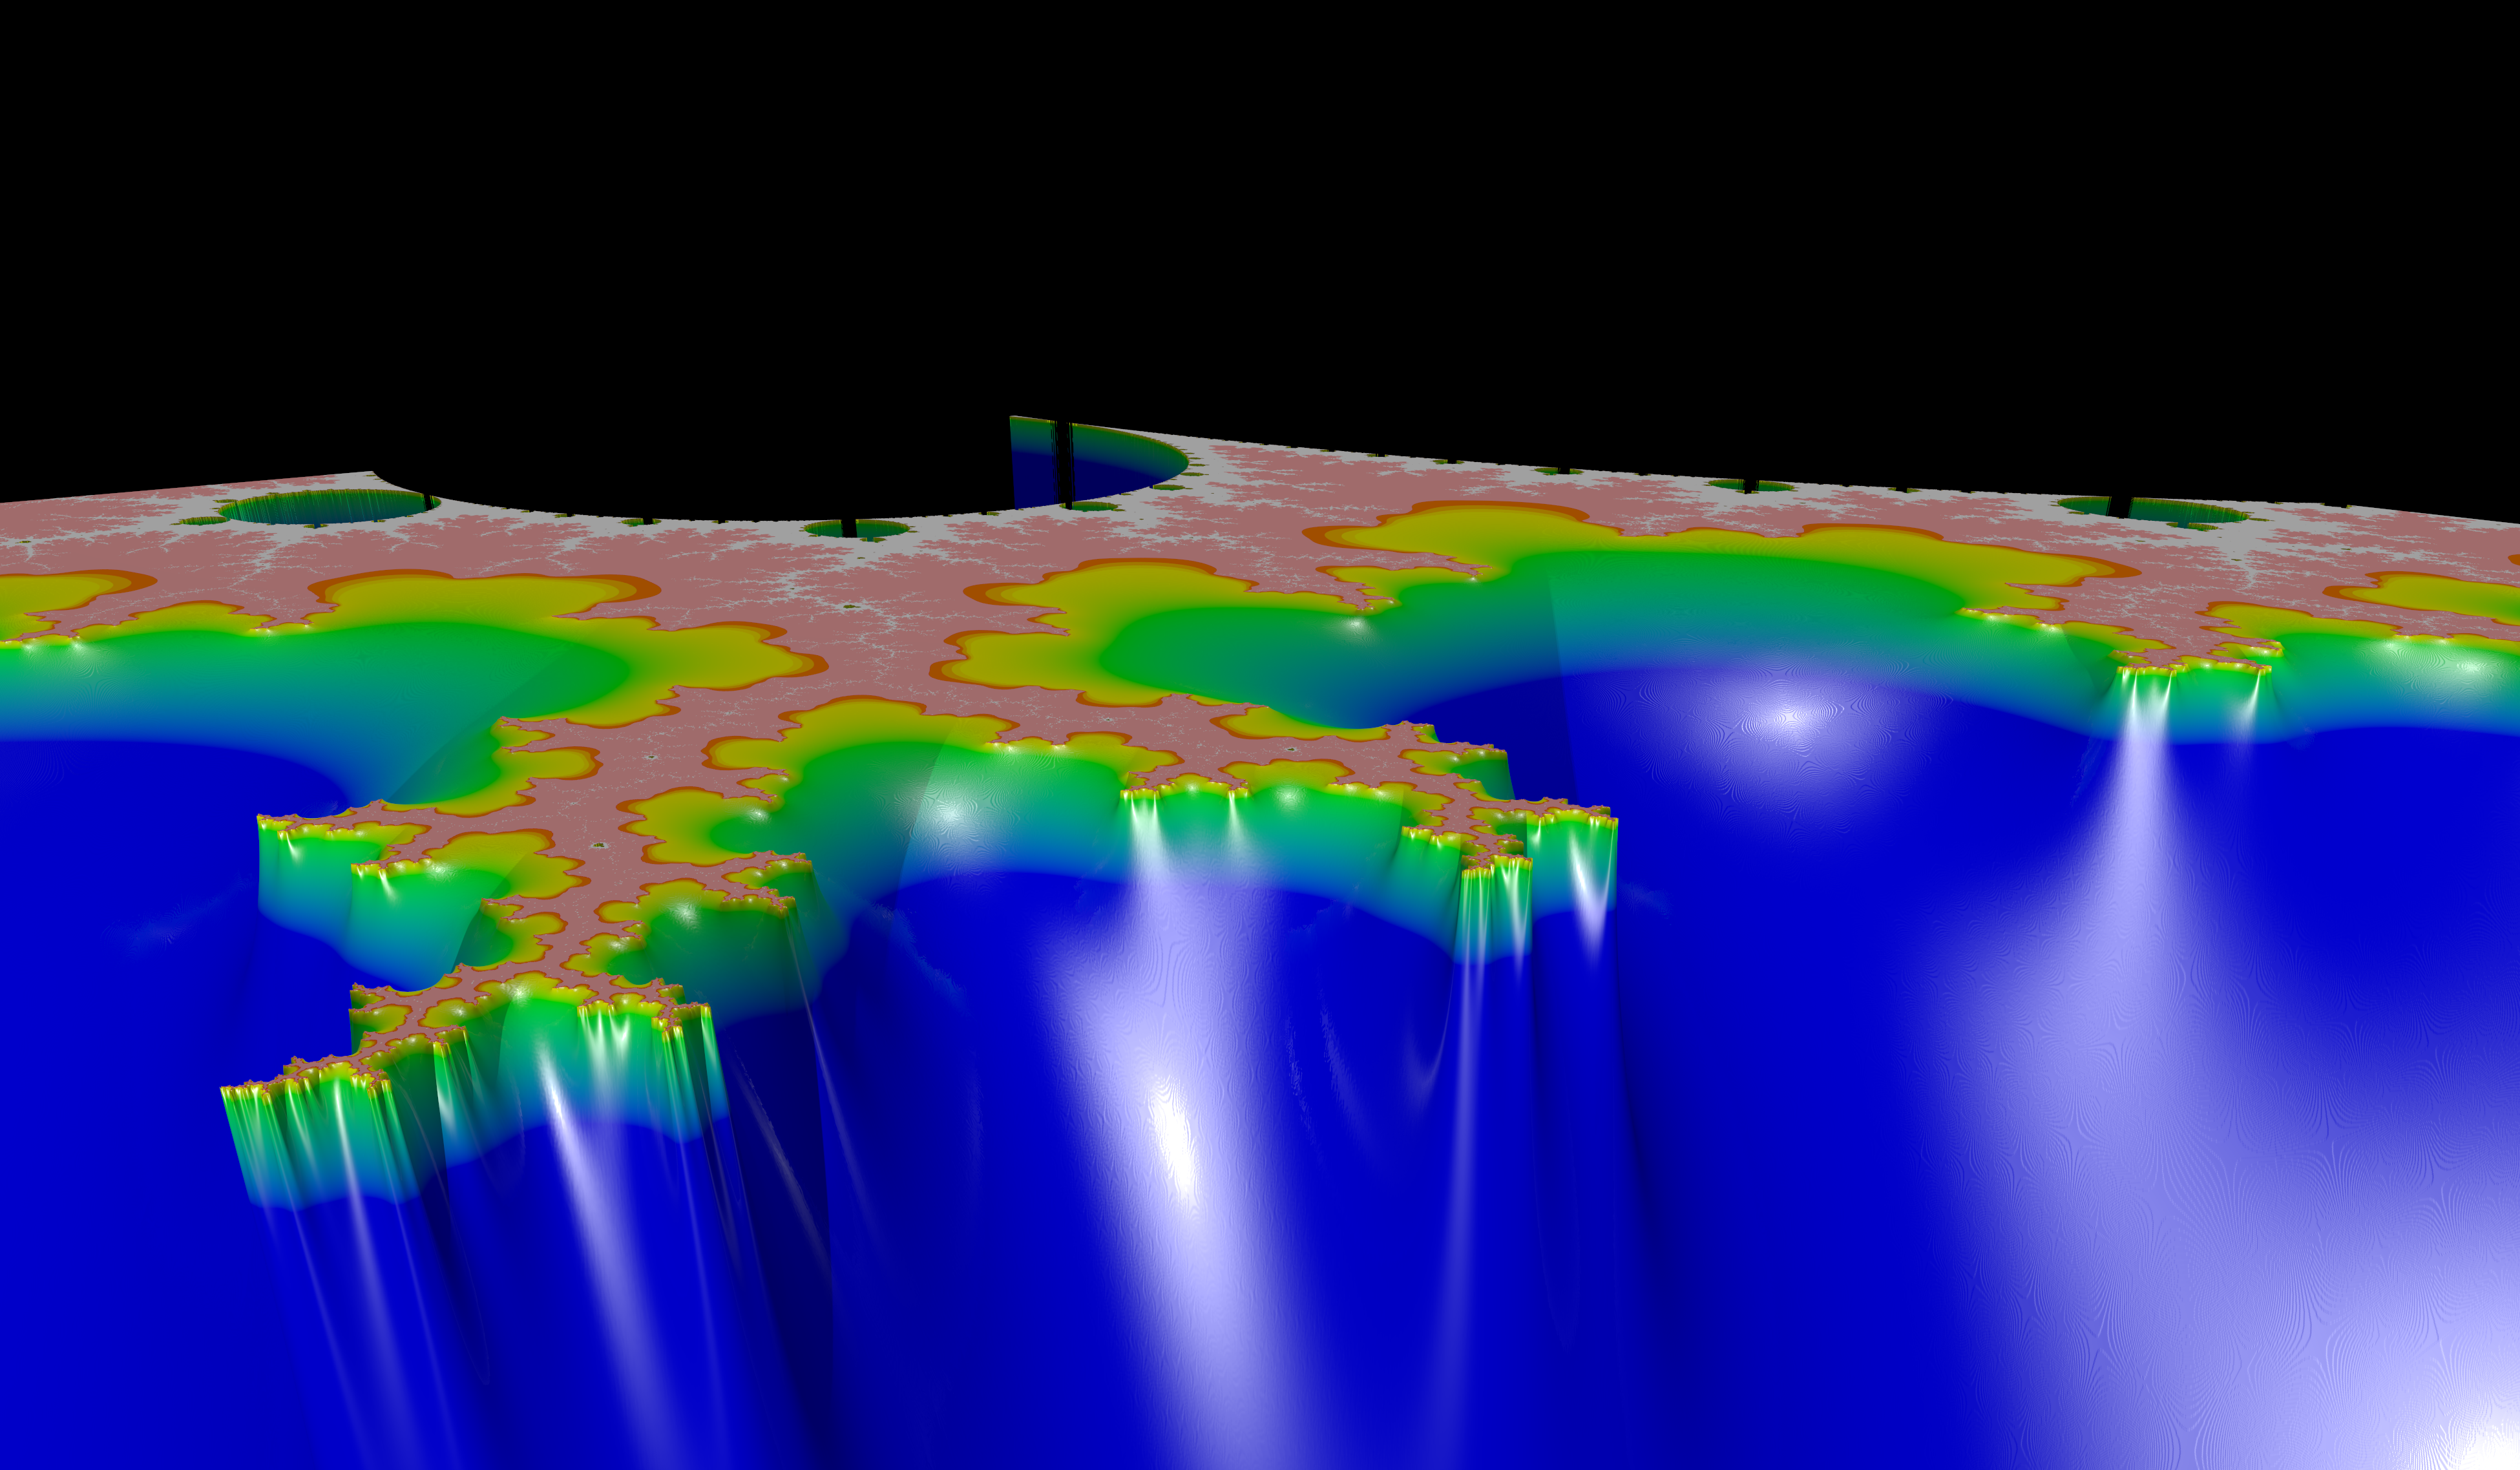
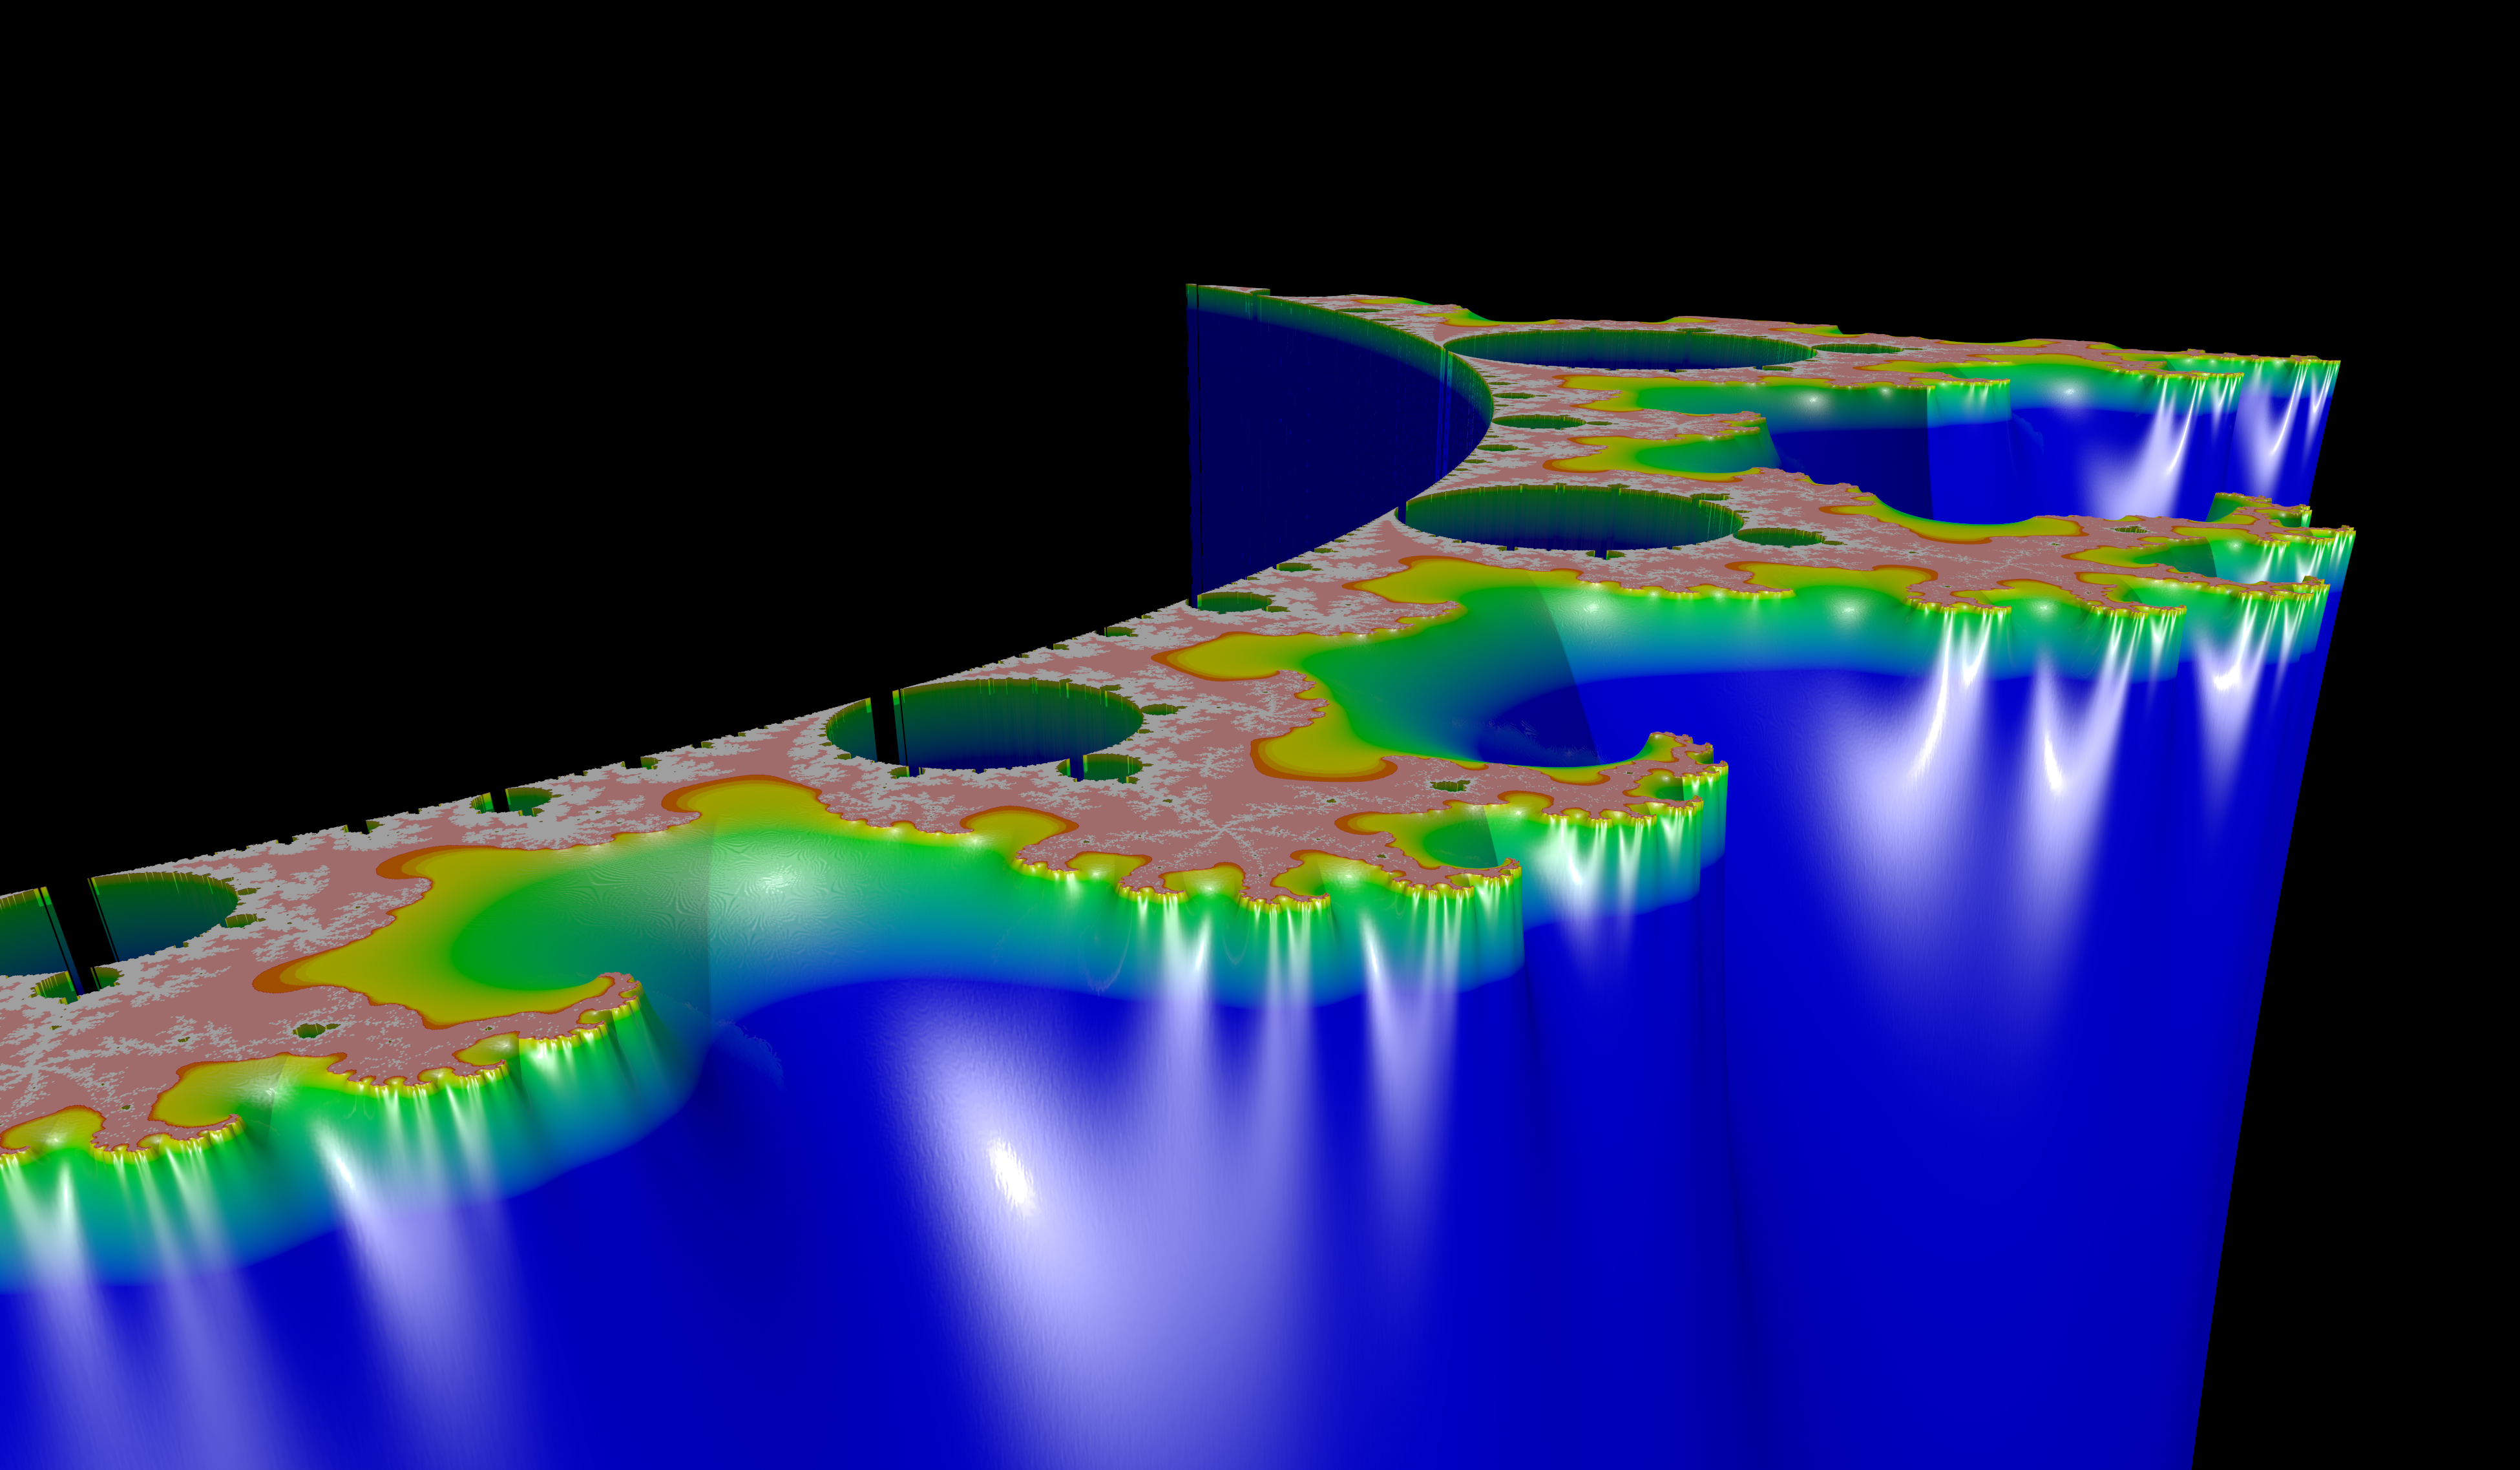
The following bit of POV-Ray code will read in that special TGA file, and spit out a nice "fractal mountain":
#include "colors.inc"

global_settings { assumed_gamma 1 }

camera {
  location <4.5, 3.7, -4.5>
  right 1.2*x
  look_at <0,1.2,0>
}

light_source { <0,100,-100> White }
light_source { <100,0,-100> White*0.5 }
light_source { <100,100,-100> White*0.5 }

height_field {
  tga "mandelbrot_potential_b_0.tga"
  smooth
  pigment {
    gradient y
    color_map {
      [0.00000 color Black  ]
      [0.99000 color Blue   ]
      [0.99900 color Green  ]
      [0.99990 color Yellow ]
      [0.99995 color Red    ]
      [0.99997 color White  ]
      [1.00000 color White  ]
    }
  }
  finish  {
    ambient .10
    diffuse 0.5
    reflection 0.07
    specular 0.65
    roughness 0.015
    phong 1
    phong_size 600
  }
  translate <-0.5, -0.9, -0.5>
  scale <10, 16.0, 10>
}
This will produce the following image:
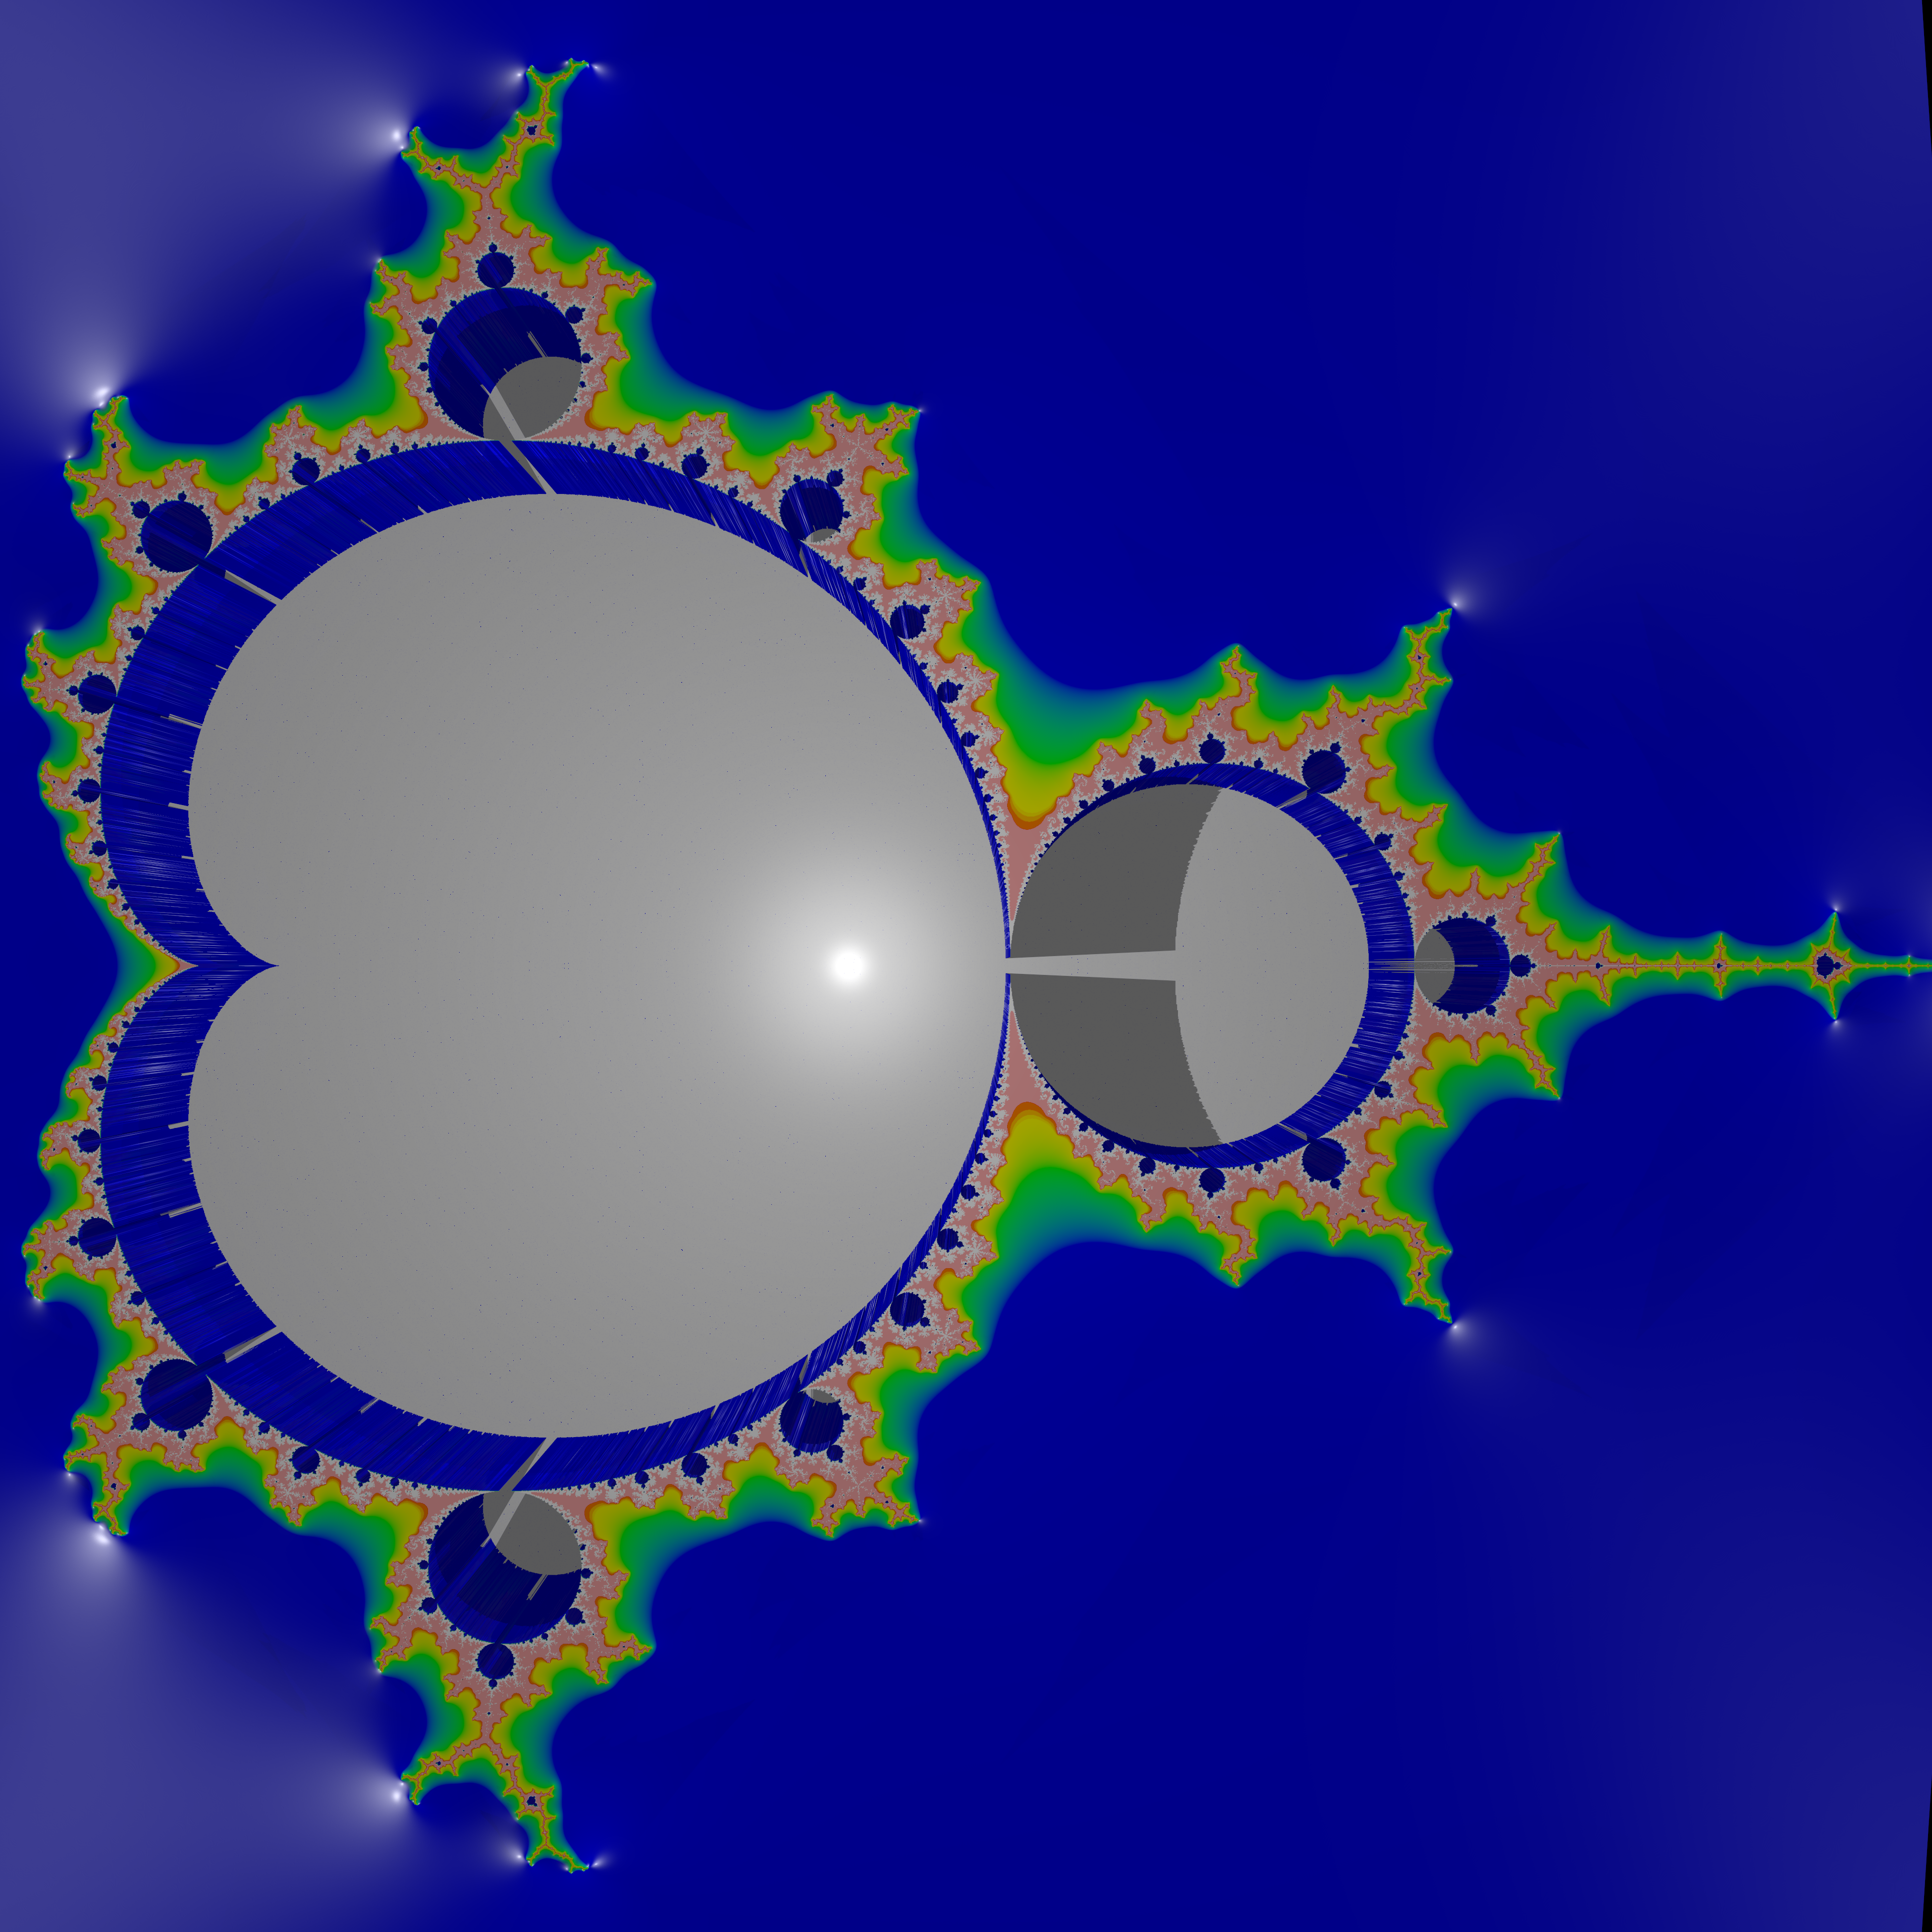
3. Gallery
4. Some Mathematical Details
4.1. Notation
- \(\mathbb{N}^0=\{n:n\ge0\,\mathrm{and}\,n\in\mathbb{Z}\}\)
- \(\mathbb{N}=\mathbb{N}^+=\{n:n>0\,\mathrm{and}\,n\in\mathbb{Z}\}\).
- Let \(f:D\rightarrow D\) be a function. Now we can define \(f^{(n)}(z)\), with \(n\in\mathbb{N}^+\), recursively \[\begin{array}{rcll} f^{(1)}(z) & = & f(z) & \mbox{ and } \\ f^{(n)}(z) & = & f(f^{(n-1)}(z)) & \\ \end{array}\] For example, \(f^{(2)}(z)=f(f(z))\) and \(f^{(3)}(z)=f(f(f(z)))\).
- \(\bar{B}(c,r)=\left\{z\in\mathbb{C}:\vert c-z\vert\le r\right\}\)
4.2. What is the Mandelbrot Set?
Next we define \(f:\mathbb{C}\rightarrow\mathbb{C}\), for some fixed \(c\in\mathbb{C}\), as:
\[f(z)=z^2+c\]
Next we define the orbit of \(c\):
\[\gamma_c=\left\{f^{(n)}(c): n\in\mathbb{N^+}\right\}\]
Finally we define the Mandelbrot set, \(M\subset\mathbb{C}\), as:
\[M=\left\{c\in\mathbb{C} : \gamma_c\mathrm{\; is\; bounded}\right\}\]
4.3. Integer Escape Function
Pictures of the Mandelbrot set are often very colorful. What can the colors possibly represent given that the Mandelbrot set is nothing more than a ``simple'' set in the complex plane? The most important thing to realize is that the colors almost never represent the Mandelbrot set, but rather some artifact of the method used to approximate the set. The most typical source of color is from the function defined in this section, which is closely related to the convergence of the sequence found in the Mandelbrot set definition previously given.
We define \(f(z)=z^2+c\) as before. For any fixed \(b\in\mathbb{R}_{>0}=(0,\infty]\), we define an integer escape function \(L_b:\mathbb{C}\rightarrow\mathbb{N}^0\) by
\[L_b(c)=\left\{ \begin{array}{ll} \min\left(\left\{n\in\mathbb{N}^0: \vert f^{(n)}\vert>b \right\}\right) & \mbox{if $c\notin M$} \\ 0 & \mbox{if $c\in M$} \\ \end{array} \right.\]
That is to say, \(L_b\) is defined to be the lest integer such that \(f^{(n)}\) is outside of the disk of radius \(b\) centered at \(0\).
It may be shown that \(M\subset \bar{B}(0,2)\), and this makes \(L_2(c)\) a very special case. It is for this reason that \(L_2(c)\) is the source for the color schemes used for most Mandelbrot set images, and the reason \(L(c)\) is frequently used to denote \(L_2(c)\).
4.4. Potential Function
Let \(\widehat{L}_b:\mathbb{C}\rightarrow\mathbb{R}\) denote the natural extension of \(L_b\) to \(\mathbb{R}\). Clearly \(\widehat{L}_b\) is not continuous, and this explains why the colors found surrounding most Mandelbrot set images are not "smooth". In this section we present a continuous function, \(G\), that is most commonly interpreted as the "electrostatic potential" of the Mandelbrot set. We define the function \(G:\mathbb{C}\rightarrow\mathbb{R}\) by
\[G(c)=\lim_{n\to\infty}\frac{\log\vert f^{(n)}\vert}{2^n}\]
It is easy to show that all level curves of \(G\), also called equipotential curves of \(M\), are topological circles. From this fact it follows that \(M\) is connected.
4.5. Escape Time Function
The function presented in this section has the flavor of \(L\) but the continuity of \(G\). We define the escape time function by:
\[E(c)=-\log_2(G(c))\]
4.6. Distance Bounds
The function \(G\) leads to a distance bound result.
Let \(c\in\mathbb{C}\setminus M\), the the distance \(d(c, \partial M)\) can be bounded by
\[\frac{\sinh G(c)}{2 e^{G(c)}\vert G'\vert} \leq d(c, \partial M)\leq \frac{2\sinh G(c)}{\vert G'\vert}\]
A similar result exists for \(c\in M\), but is a bit more complex.
4.7. Random Results
This section enumerates several random results that may be useful.
- \(M\) is closed.
- \(M\) is connected.
- \(M\) is simply connected.
- \(M\) is bounded.
- \(M\) is contained in a disk centered at \(0\) of radius \(2\) (i.e. \(B(0,2)\)).