Measurements
| Author: | Mitch Richling |
| Updated: | 2022-12-02 |
Copyright 2022 Mitch Richling. All rights reserved.
Table of Contents
1. Measured Perfs
1.1. Data
| Horiz | Vert | Note |
|---|---|---|
| 11.5 | 11.3845 | |
| 11.484 | 11.3915 | |
| 11.473 | 11.4015 | |
| 0.0 | 0.0 | |
| 11.4855 | 11.3845 | |
| 0.0 | 0.0 | |
| 0.0 | 0.0 | |
| 11.275 | 11.3885 | Estimated |
| 11.5 | 11.3845 | Estimated |
| 11.531 | 11.49 | |
| 11.443 | 11.448 | |
| 0.0 | 0.0 | |
| 11.476 | 11.454 | |
| 11.479 | 11.4155 | |
| 11.3385 | 11.442 | |
| 11.449 | 11.4385 | |
| 11.4845 | 11.36 | |
| 11.4885 | 11.432 | |
| 11.4965 | 11.379 | |
| 10.951 | 11.4205 | |
| 10.9015 | 10.81 | |
| 11.537 | 11.405 | |
| 10.824 | 11.400333333333334 | |
| 10.846 | 11.43 | |
| 11.485 | 11.3635 | |
| 11.4915 | 11.3325 | |
| 11.488 | 11.3685 | |
| 0.0 | 0.0 | |
| 11.5665 | 11.3585 | Estimated |
| 0.0 | 0.0 | |
| 11.481 | 11.418 | |
| 0.0 | 0.0 | |
| 11.457 | 11.386 | |
| 11.44 | 11.4325 | |
| 11.478 | 11.3755 | |
| 11.4225 | 11.452 | |
| 11.431 | 11.3915 | |
| 10.8505 | 11.44575 | |
| 11.5065 | 11.384 | |
| 11.431 | 11.458 | |
| 11.397 | 11.405 | |
| 0.0 | 0.0 | |
| 11.5055 | 11.3835 | |
| 0.0 | 0.0 | |
| 11.3575 | 11.4615 | Estimated |
| 0.0 | 0.0 | |
| 11.4005 | 11.4415 | |
| 11.484 | 11.369 | |
| 11.5025 | 11.3575 | |
| 11.4965 | 11.3765 | |
| 11.52 | 11.3995 | |
| 10.891 | 10.8195 | |
| 11.092 | 11.6145 | Estimated |
| 10.8805 | 11.4525 | |
| 11.4905 | 11.4325 | |
| 11.558 | 11.506 | |
| 11.0055 | 11.455 | |
| 10.879 | 11.4455 | |
| 11.4415 | 11.431 | |
| 11.486 | 11.404 | |
| 0.0 | 11.4125 | |
| 0.0 | 11.474 | |
| 11.4545 | 0.0 | |
| 11.4905 | 0.0 | |
| 0.0 | 0.0 | |
| 0.0 | 0.0 | |
| 11.431 | 11.459 | Large Rough |
| 11.491 | 11.3545 | Imperforate at top |
| 11.574 | 11.4 | Imperforate at top |
| 11.458 | 11.361 | |
| 11.496666666666664 | 11.393333333333333 | |
| 11.484333333333334 | 11.374333333333334 | |
| 10.913 | 10.811333333333332 | |
| 11.511333333333333 | 11.394666666666666 | |
| 10.916 | 11.398 | |
| 10.916 | 11.404 | |
| 10.905333333333333 | 11.411 | |
| 11.0 | 11.5 | |
| 11.3635 | 0.0 | Estimated |
| 0.0 | 11.4075 | |
| 0.0 | 11.362 | Estimated |
| 0.0 | 11.408 | Estimated |
| 0.0 | 11.366 | Estimated |
| 0.0 | 11.389 | Estimated |
| 0.0 | 11.4175 | Estimated |
| 0.0 | 0.0 | |
| 0.0 | 0.0 | |
| 0.0 | 0.0 | |
| 0.0 | 0.0 | |
| 11.416 | 11.4405 | |
| 11.525 | 11.453 | |
| 11.4955 | 11.4325 | |
| 10.85 | 11.493 | |
| 10.9085 | 11.3775 | |
| 10.847 | 11.3975 | |
| 11.042 | 11.5115 | |
| 10.924 | 10.877 | |
| 10.7985 | 10.856 | |
| 10.847 | 10.889 | |
| 10.8605 | 10.8985 | |
| 11.4705 | 11.3835 | |
| 11.4795 | 11.389 | |
| 11.4785 | 11.342 | |
| 11.432 | 11.428 | |
| 11.4505 | 11.4135 | |
| 11.481 | 11.4305 | |
| 11.455 | 11.468 | |
| 11.409 | 11.438500000000001 | |
| 0.0 | 0.0 | |
| 11.4295 | 11.395 | |
| 11.4245 | 11.423 | Large Rough |
| 11.4465 | 11.407 | Large Rough |
| 11.5125 | 11.466 | |
| 11.4125 | 11.4295 | |
| 11.426 | 11.4315 | |
| 10.952 | 10.8225 | |
| 11.486 | 11.41 | |
| 11.5445 | 11.4765 | |
| 11.3875 | 11.4595 | |
| 11.465 | 11.4845 | |
| 10.899 | 10.846 | |
| 10.872 | 10.805 | |
| 11.508 | 11.453 | |
| 10.861 | 10.877333333333333 | |
| 11.494333333333332 | 11.377333333333333 | |
| 10.915 | 11.38966666666666 | |
| 10.91233333333333 | 11.382 | |
| 10.877 | 11.3885 | |
| 11.452333333333334 | 11.427 | |
| 0.0 | 0.0 | |
| 11.5075 | 11.3955 | |
| 11.371 | 11.4085 | |
| 11.531 | 11.4205 | |
| 11.5335 | 11.41 | |
| 11.508 | 11.373 | |
| 11.5025 | 11.374 | |
| 11.472 | 11.3885 | |
| 11.4715 | 11.4345 | |
| 11.395 | 11.4255 | |
| 11.5445 | 11.401 | |
| 11.524 | 11.4015 |
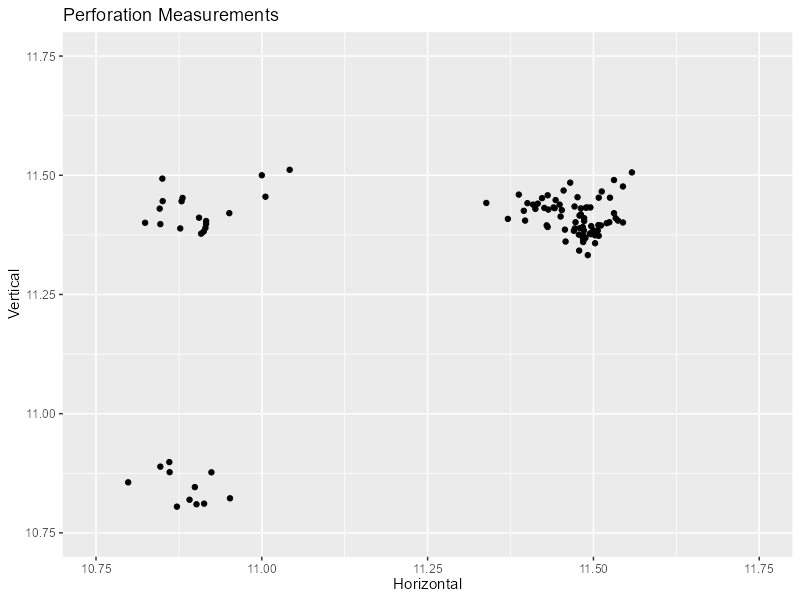
1.2. X-Y Plot
g <- ggplot(perfhv %>% filter(Horiz>0, Vert>0, Note==""),
            aes(x=Horiz, y=Vert)) +
  geom_point() +
  scale_x_continuous(limits=c(10.75, 11.75), breaks=seq(10.75, 11.75, 1/4)) +
  scale_y_continuous(limits=c(10.75, 11.75), breaks=seq(10.75, 11.75, 1/4)) +
  labs(title="Perforation Measurements", x="Horizontal", y="Vertical")
print(g);
ggsave("perfhv-xy.png", width=8, height=6, dpi=100, units='in', plot=g);
ggsave("perfhv-xy.pdf", width=8, height=6, dpi=600, units='in', plot=g);
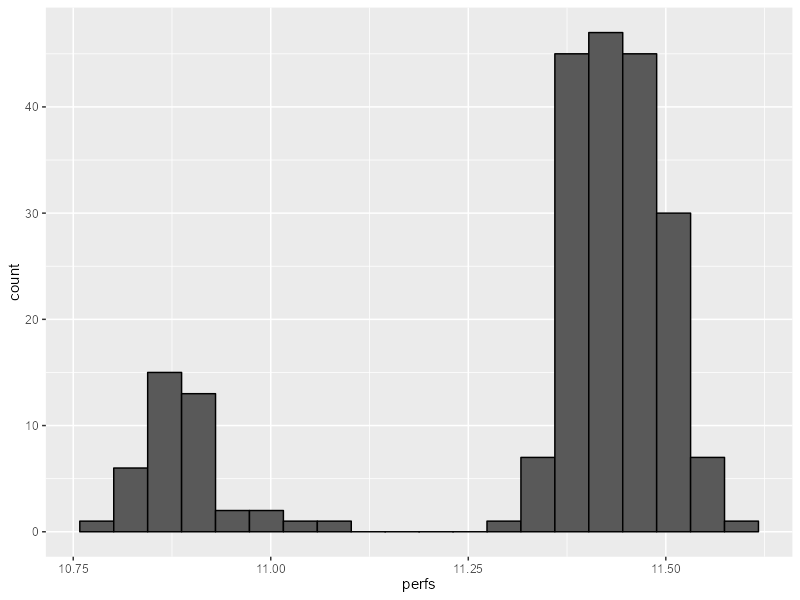
1.3. Histogram
g <- ggplot(perfhv %>%
              filter(Horiz>0, Vert>0) %>%
              tidyr::pivot_longer(cols=1:2, names_to='side', values_to='perfs'),
            aes(x=perfs)) +
  geom_histogram(col='black', bins=20)
print(g);
ggsave("perfhv-hist.png", width=8, height=6, dpi=100, units='in', plot=g);
ggsave("perfhv-hist.pdf", width=8, height=6, dpi=600, units='in', plot=g);
2. Measured Paper Size
In this section, "Paper Size" is the nearist distance between the edges of perforation holes from parallel rows of perforations.
2.1. Data
| Horiz | Vert |
|---|---|
| 26.057 | 29.107 |
| 25.464 | 29.658 |
| 25.421 | 29.192 |
| 25.061 | 29.128 |
| 25.633 | 28.429 |
| 24.913 | 28.980 |
| 25.061 | 29.446 |
| 26.173 | 29.203 |
| 25.146 | 28.938 |
| 25.294 | 29.573 |
| 25.379 | 29.467 |
| 25.146 | 29.023 |
| 26.184 | 29.139 |
| 25.231 | 29.552 |
| 25.019 | 29.594 |
| 25.442 | 29.616 |
| 25.019 | 29.277 |
| 25.252 | 29.594 |
| 25.993 | 29.001 |
| 25.527 | 29.213 |
| 25.993 | 28.599 |
| 25.072 | 28.726 |
| 25.760 | 29.361 |
| 26.269 | 29.128 |
| 25.803 | 29.277 |
| 26.332 | 29.086 |
| 25.845 | 29.192 |
| 25.209 | 29.277 |
| 26.290 | 29.319 |
| 25.760 | 29.256 |
| 26.057 | 29.785 |
| 25.273 | 29.065 |
| 25.760 | 29.510 |
| 25.633 | 29.319 |
| 24.764 | 29.001 |
| 25.697 | 29.658 |
| 25.644 | 29.489 |
| 25.294 | 29.319 |
| 25.845 | 28.980 |
| 25.464 | 29.277 |
| 25.379 | 29.319 |
| 25.739 | 29.150 |
| 25.252 | 29.107 |
| 25.485 | 29.594 |
| 25.760 | 29.489 |
| 25.961 | 30.251 |
| 25.951 | 29.298 |
| 25.898 | 29.298 |
| 25.834 | 30.061 |
| 25.167 | 29.361 |
| 25.760 | 29.340 |
| 26.163 | 29.256 |
| 25.675 | 29.065 |
| 25.548 | 28.895 |
| 25.061 | 28.260 |
| 25.569 | 28.895 |
| 24.913 | 30.188 |
| 25.442 | 29.340 |
| 25.506 | 29.065 |
| 24.267 | 29.700 |
| 25.103 | 29.393 |
| 25.379 | 28.980 |
| 25.845 | 29.404 |
| 24.447 | 29.128 |
| 25.231 | 29.425 |
| 25.209 | 28.959 |
| 25.760 | 29.404 |
| 26.057 | 29.489 |
| 25.442 | 29.383 |
| 26.057 | 28.758 |
| 25.231 | 29.340 |
| 25.633 | 29.404 |
| 25.421 | 29.139 |
| 25.760 | 29.107 |
| 25.082 | 29.107 |
| 25.834 | 29.436 |
| 25.908 | 29.361 |
| 25.612 | 29.828 |
| 25.294 | 29.256 |
| 25.781 | 30.145 |
| 25.591 | 29.743 |
| 25.379 | 29.086 |
| 25.908 | 28.917 |
| 25.887 | 28.747 |
| 25.527 | 29.467 |
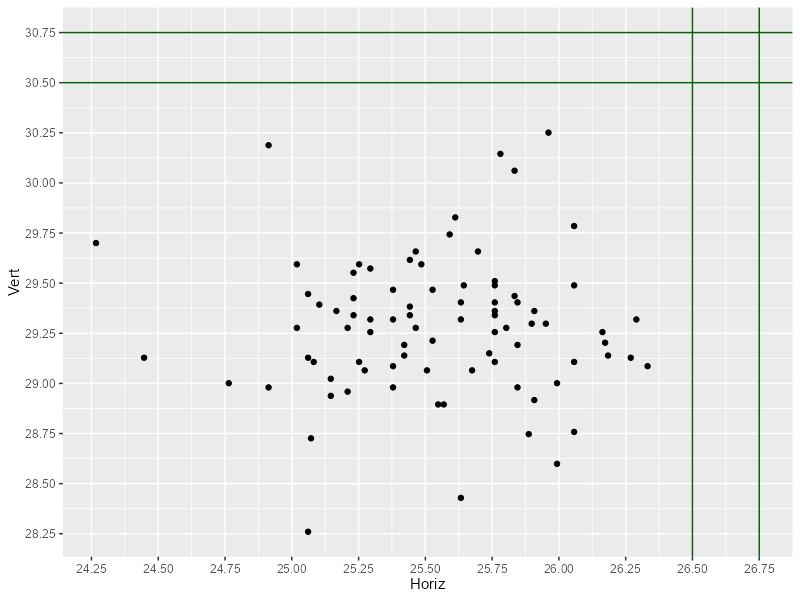
2.2. X-Y Plot
g <- ggplot(papersize %>% filter(Horiz>0, Vert>0),
            aes(x=Horiz, y=Vert)) +
  geom_hline(yintercept=30.75, col='darkgreen') +
  geom_hline(yintercept=30.5, col='darkgreen') +
  geom_vline(xintercept=26.5, col='darkgreen') +
  geom_vline(xintercept=26.75, col='darkgreen') +
  scale_x_continuous(breaks=seq(24, 31, 1/4)) +
  scale_y_continuous(breaks=seq(28, 31, 1/4)) +
  geom_point()
print(g)
ggsave("papersize-xy.png", width=8, height=6, dpi=100, units='in', plot=g);
ggsave("papersize-xy.pdf", width=8, height=6, dpi=600, units='in', plot=g);
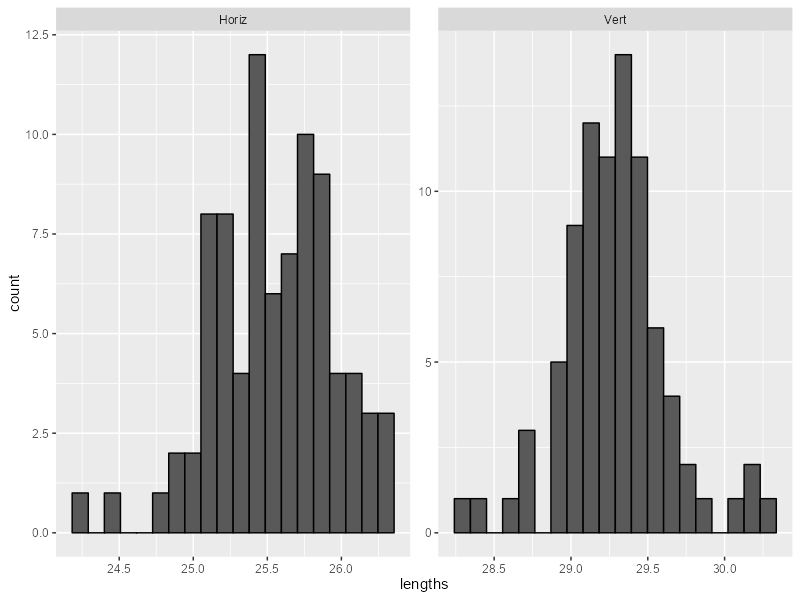
2.3. Histogram
g <- ggplot(papersize %>%
              tidyr::pivot_longer(cols=1:2, names_to='side', values_to='lengths'),
            aes(x=lengths)) +
  facet_wrap(~side, ncol=2,scales="free") +
  geom_histogram(col='black', bins=20)
print(g)
ggsave("papersize-hist.png", width=8, height=6, dpi=100, units='in', plot=g);
ggsave("papersize-hist.pdf", width=8, height=6, dpi=600, units='in', plot=g);